An honest reflection on professional stagnation, continuous learning and starting again with the fundamentals.
The Moment I Realized I Had Stopped Learning
Sometimes, one uncomfortable experience can make us question how far we have progressed professionally.
For me, that moment came during a recent technical interview assessment.
I have spent the last few years working in a data-related environment. Between daily responsibilities, project deadlines and personal commitments, I gradually stopped investing time in learning new technical concepts.
Initially, I didn’t think it would make much difference. After all, I was working with data every day. I assumed my professional experience would naturally keep my technical knowledge sharp.
Then I decided to appear for a technical assessment.
I gave myself one week to prepare and walked into the interview with reasonable confidence.
The interviewer started asking some basic questions:
- What is Power Query?
- What is ETL?
- What are the business applications of ETL?
- How do these concepts fit into data analytics?
These were not particularly advanced questions. They were fundamental concepts that I had encountered before.
I could recall bits and pieces, but I struggled to explain them clearly and connect them with practical business scenarios.
I was not completely unfamiliar with the topics. I simply wasn’t prepared enough to explain them with confidence.
That moment made me realize something important:
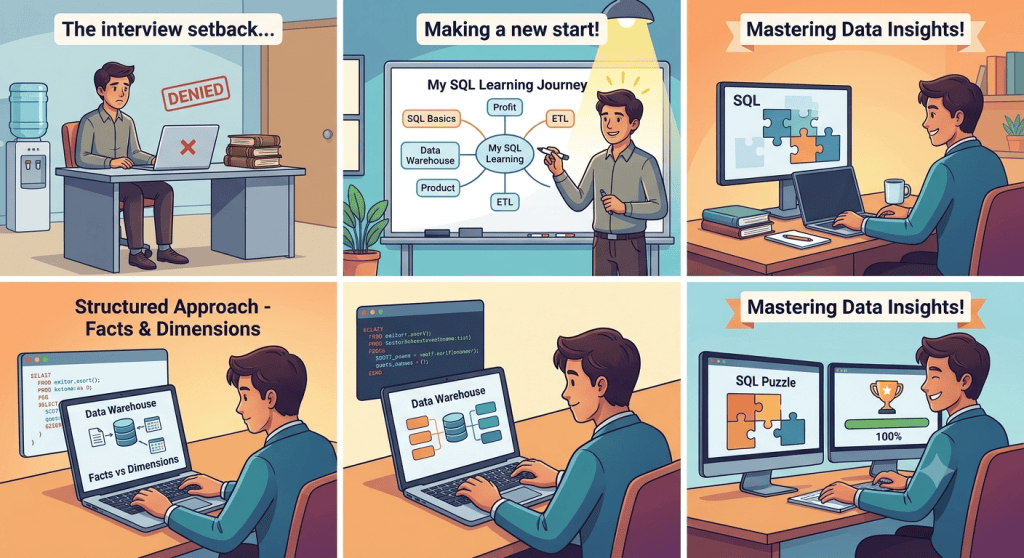
Having professional experience and having strong technical knowledge are two different things.
I had continued working, delivering reports and handling responsibilities, but I had not invested enough time in strengthening my fundamentals.
I wasn’t disappointed with the interview panel. In fact, I am grateful for that experience because it exposed a gap I had been ignoring.
It was time to start learning again.
Starting Again: Why I Chose SQL
I didn’t want to approach learning as another short-term interview preparation exercise.
I wanted to build a structured foundation that would help me become a stronger Data Analyst.
I decided to begin with SQL.
Why SQL?
Because data analysis is not just about creating dashboards or presenting numbers. Before we visualize data, we need to understand where it comes from, how it is stored, how different tables are connected and how information can be retrieved.
SQL provides the foundation for working with relational databases.
My objective is to move from understanding basic database concepts to independently solving real-world business problems.
Rather than jumping directly into complex queries, I decided to understand the fundamentals first.
1. Understanding Data Warehousing
Before learning how to retrieve information, I wanted to understand how organizations store and manage their data.
A Data Warehouse is a centralized repository that integrates information from different business systems for reporting, analysis and decision-making.
Consider an organization with different departments:
- Sales and Marketing
- Finance
- Inventory
- Supply Chain
- Customer Management
Each department generates its own data. A Data Warehouse brings relevant information together to provide a consolidated view of business performance.
Four fundamental characteristics
Subject-Oriented: Data is organized around business subjects such as customers, products and sales.
Integrated: Data from different sources is combined and standardized into a consistent structure.
Non-Volatile: Historical data is generally preserved rather than continuously overwritten.
Time-Variant: Historical information is maintained to help identify trends and changes over time.
Understanding these characteristics helped me understand why businesses need Data Warehouses and how they support analytical decision-making.
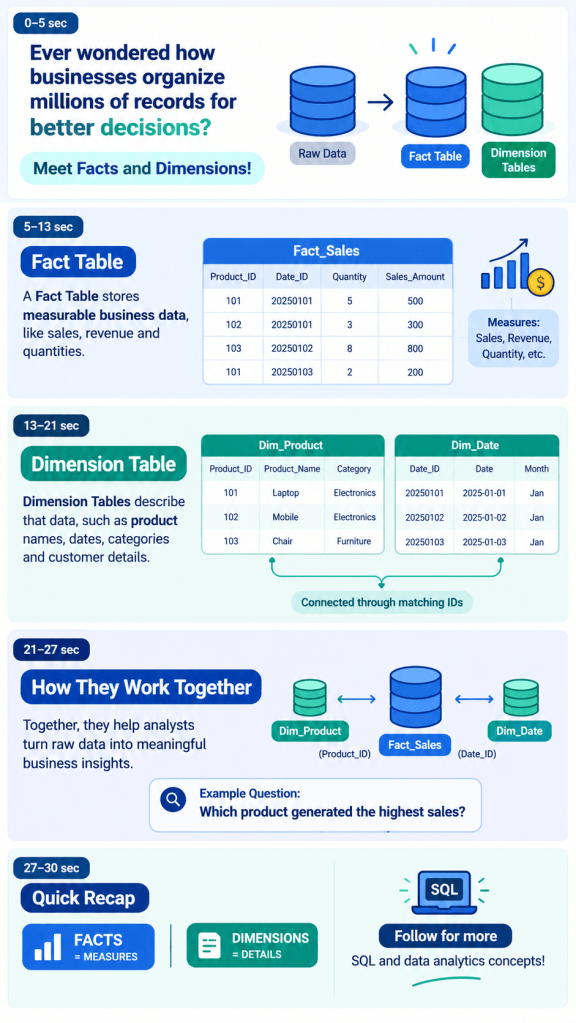
2. Facts and Dimensions: Understanding How Data Is Organized
The next concept was Facts and Dimensions, two important components of dimensional data modelling.
I found it easier to understand these concepts through a business example.
Imagine a retail company wants to analyze its sales performance.
Facts represent measurable business information.
Examples include:
- Revenue
- Total units sold
- Profit
- Number of transactions
Dimensions provide descriptive information.
Examples include:
- Product
- Customer
- Location
- Date
Now consider a business question:
“What were our top-selling products in Mumbai during October?”
To answer this question, we need sales quantity or revenue as the measure. We then use product, location and date to understand and categorize the results.
This helped me understand an important principle:
Facts tell us what happened, while dimensions help us understand where, when and in which business context it happened.
3. Relational Data Model: How Do Tables Connect?
One of the most important concepts in my learning journey is the Relational Data Model.
Relational databases organize information into tables consisting of rows and columns.
Each table represents a particular entity, and relationships between tables allow us to retrieve connected information.
Let’s take a simple example.
Customer Table
| Customer_ID | Customer_Name | City |
|---|---|---|
| 101 | Rahul | Pune |
| 102 | Amit | Mumbai |
Orders Table
| Order_ID | Customer_ID | Amount |
|---|---|---|
| 501 | 101 | 5,000 |
| 502 | 102 | 8,000 |
Here, Customer_ID connects the Customer and Orders tables.
Instead of maintaining customer details repeatedly in every order record, we can store customer information separately and establish a relationship between the tables.
This is where database keys and constraints become important.
The next concepts I am exploring include:
- Entities and Attributes
- Primary Keys and Foreign Keys
- Entity Integrity
- Referential Integrity
- Domain Constraints
- Key Constraints
My objective is to understand not only what these terms mean but also why databases need them.
4. ETL vs. ELT: Understanding Data Movement
Another important concept I revisited was ETL and ELT.
Both are processes used to move and prepare data for analytical systems.
ETL: Extract, Transform, Load
- Extract data from different sources.
- Transform the data by cleaning, validating and preparing it.
- Load the transformed data into the target system.
ELT: Extract, Load, Transform
- Extract data from different sources.
- Load the raw data into the target environment.
- Transform the data within that environment.
| ETL | ELT |
|---|---|
| Transformation happens before loading | Transformation happens after loading |
| Uses a separate transformation stage | Uses the target platform for transformation |
| Common in traditional architectures | Common in modern cloud data platforms |
Understanding ETL and ELT also helped me connect SQL with the broader data engineering process.
I am beginning to see that writing SQL queries is only one part of understanding how data moves through an organization.
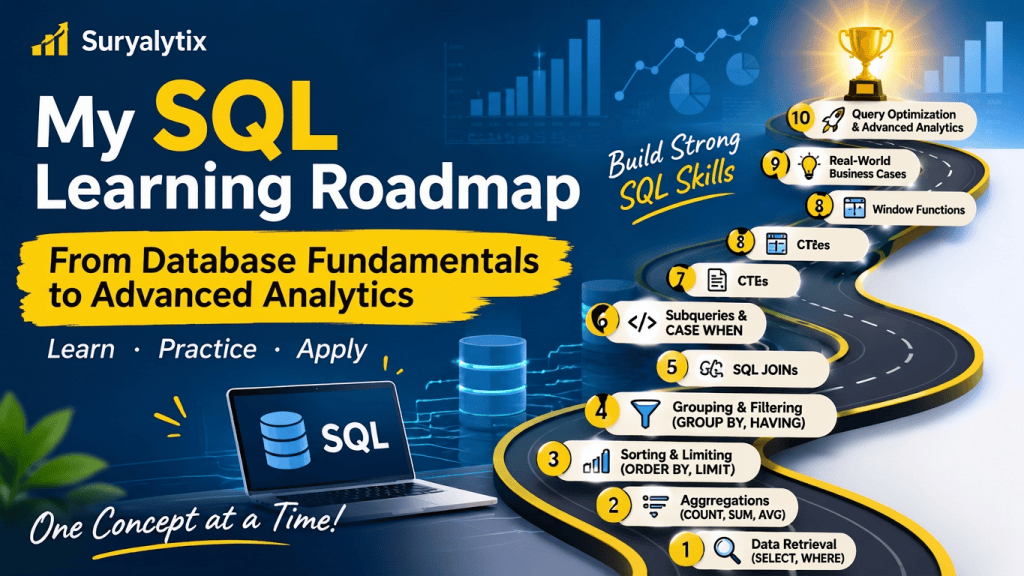
5. My SQL Learning Roadmap
After revisiting database fundamentals, I created a structured roadmap to develop practical SQL skills.
I don’t want to memorize commands without knowing when and why to use them.
My learning journey is divided into ten stages.
| Stage | Topics |
|---|---|
| 1 | SELECT, DISTINCT, WHERE |
| 2 | ORDER BY, LIMIT |
| 3 | COUNT, SUM, AVG, MIN, MAX |
| 4 | GROUP BY, HAVING |
| 5 | INNER, LEFT, RIGHT and FULL JOIN |
| 6 | Subqueries and nested queries |
| 7 | CASE WHEN |
| 8 | Common Table Expressions (CTEs) |
| 9 | Window Functions |
| 10 | Real-world business problems and query optimization |
Each stage will involve three activities:
Learn: Understand the concept and its purpose.
Practice: Write queries and solve practical questions.
Apply: Use SQL to answer business-related questions.
I believe this approach will help me develop a deeper understanding instead of simply remembering syntax.
6. Moving from SQL Knowledge to Analytical Thinking
My ultimate objective is not to become someone who can only write basic SQL queries.
I want to develop the ability to understand a business requirement and translate it into a logical analytical solution.
Consider this question:
“A company wants to identify products whose sales have declined compared with the previous month.”
To solve this problem, I would need to:
- Identify the relevant sales tables.
- Retrieve monthly sales information.
- Aggregate sales by product and month.
- Compare the current month’s sales with the previous month.
- Identify products showing a decline.
- Present the findings in a meaningful format.
This is where concepts such as JOINs, GROUP BY, CTEs and window functions become useful.
I want to reach a point where I can approach such questions independently, structure my logic and write the SQL required to solve them.
What I Have Learned So Far
This experience has changed how I look at professional development.
Previously, I thought that working in a data-related role would automatically improve my technical knowledge.
Now I understand that experience gives us exposure, but continuous practice develops expertise.
I don’t expect to master SQL in a few days or become an expert simply by completing a learning roadmap.
There will be mistakes, difficult concepts and problems that require multiple attempts.
That is part of learning.
Final Thoughts: The Journey Starts Again
Going blank during an interview was not a pleasant experience.
However, it made me recognize something I had neglected for a long time: learning should not stop once we get comfortable in a job.
Technology changes, business requirements evolve and the expectations from data professionals continue to grow.
The responsibility to keep improving belongs to us.
I am starting again with the fundamentals, one concept and one SQL problem at a time.
I may not have all the answers today, but I know what I need to work on.
My goal is not just to learn SQL or prepare for another interview. It is to become a better Data Analyst and a stronger problem solver.
This is my journey of learning, practising, making mistakes and improving.
And this time, I want consistency to become a part of my professional life.


Leave a Reply